Cape Town Airbnb performance in 2026: how does your property compare?
Key Findings:
- The Cape Town Airbnb market grew supply by 20% year on year and demand kept pace
- The gap between peak season performance and market average occupancy translates to approximately R40,000 per property
- Properties with active professional management generate a disproportionately higher share of total bookings
- The median guest books within 14 days of arrival. How that window is managed determines income
- The biggest cost most owners never see is underperformance, and it compounds every month
- Airbnb income in Cape Town is real, growing, and increasingly determined by how well a property is managed
In this article:
The Cape Town Airbnb market in 2026: what the data actually shows
That R40,000 figure is actually a conservative estimate, and understanding why requires knowing the three numbers that ultimately determine Airbnb income in Cape Town.
Occupancy rate is the percentage of available nights that are actually booked. If your property is available for 300 nights and guests stayed for 200 of them, your occupancy rate is 67%, which is almost exactly where the Cape Town market sits on an annual basis. Two in every three available nights being booked across the market as a whole. That is the baseline every owner should be measuring against.
Average nightly rate is what guests actually paid per night across all bookings, accounting for seasonal variation, platform differences, and how actively the pricing was managed. This number varies significantly between properties in the same market, in the same street, with similar bedrooms and similar views.
Revenue per available night combines both into a single performance measure. It accounts for what a property charged and how consistently someone paid it, making it the most complete indicator of how a property is performing relative to its potential. A property charging a premium rate but sitting half empty earns less than a well-priced property that stays consistently booked. Getting both right simultaneously is where the real income lives.
The reason the R40,000 estimate is conservative is that it was calculated using only the occupancy gap, with the nightly rate held constant across both scenarios. In reality, actively managed properties in this market also achieve meaningfully higher average nightly rates than self-managed equivalents. When both variables are working together, the annual income gap between a professionally managed property and a self-managed one is considerably wider than a single peak season occupancy calculation suggests.
Now to the broader market picture, because the context matters. Over the past year, across more than 800 active Cape Town Airbnb listings, the performance data is considerably more compelling than the general conversation suggests. Supply grew by roughly 20% year on year. More listings, more competition, a more crowded market by any surface reading. And yet bookings grew alongside that supply increase, across every bedroom category. Average nightly rates moved upward. Revenue per available night increased. The market absorbed a significant wave of new listings and continued to strengthen. For owners wondering whether the opportunity is still real, the data answers that question clearly.
The market is maturing. Supply is rising, demand is keeping pace, rates are strengthening, and the gap between properties that are managed with precision and properties that are running on autopilot is becoming one of the most significant performance differentiators in the Cape Town Airbnb market. The data shows exactly what that gap looks like, and exactly what is driving it.
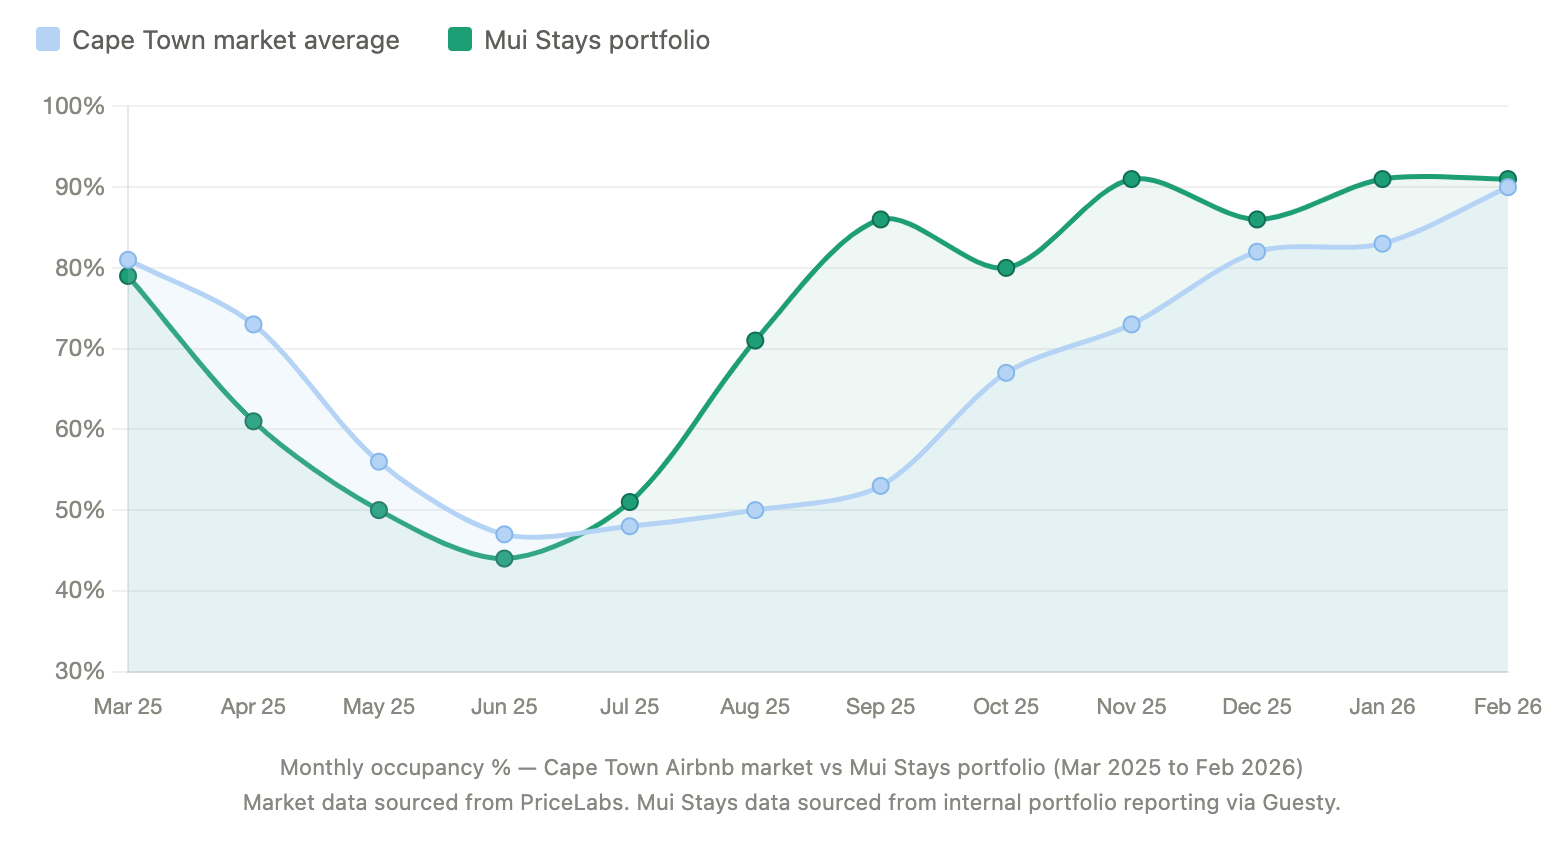
If you look closely at the occupancy chart, you will notice a dip in the Mui Stays line through the early winter months. That period coincided with the onboarding of a significant number of brand new apartments from Wavescapes, a luxury development in the heart of Muizenberg, coming onto the rental market for the very first time. Each required full setup and preparation before they could be listed, which naturally affected portfolio averages through the shoulder season. By peak season those same properties were among the strongest contributors to the results you see at the right of that chart.
Why the same market produces completely different results
Picture this. You own a two-bedroom apartment in Cape Town. You listed it on Airbnb yourself a couple of years ago, took some decent photos, set a price that felt right, and started receiving bookings. Guests arrive, leave reasonable reviews, and income lands in your account. You adjust the rate occasionally, up in December and down a little in winter. It feels like things are working.
The question worth sitting with is whether your property is performing anywhere near its actual potential.
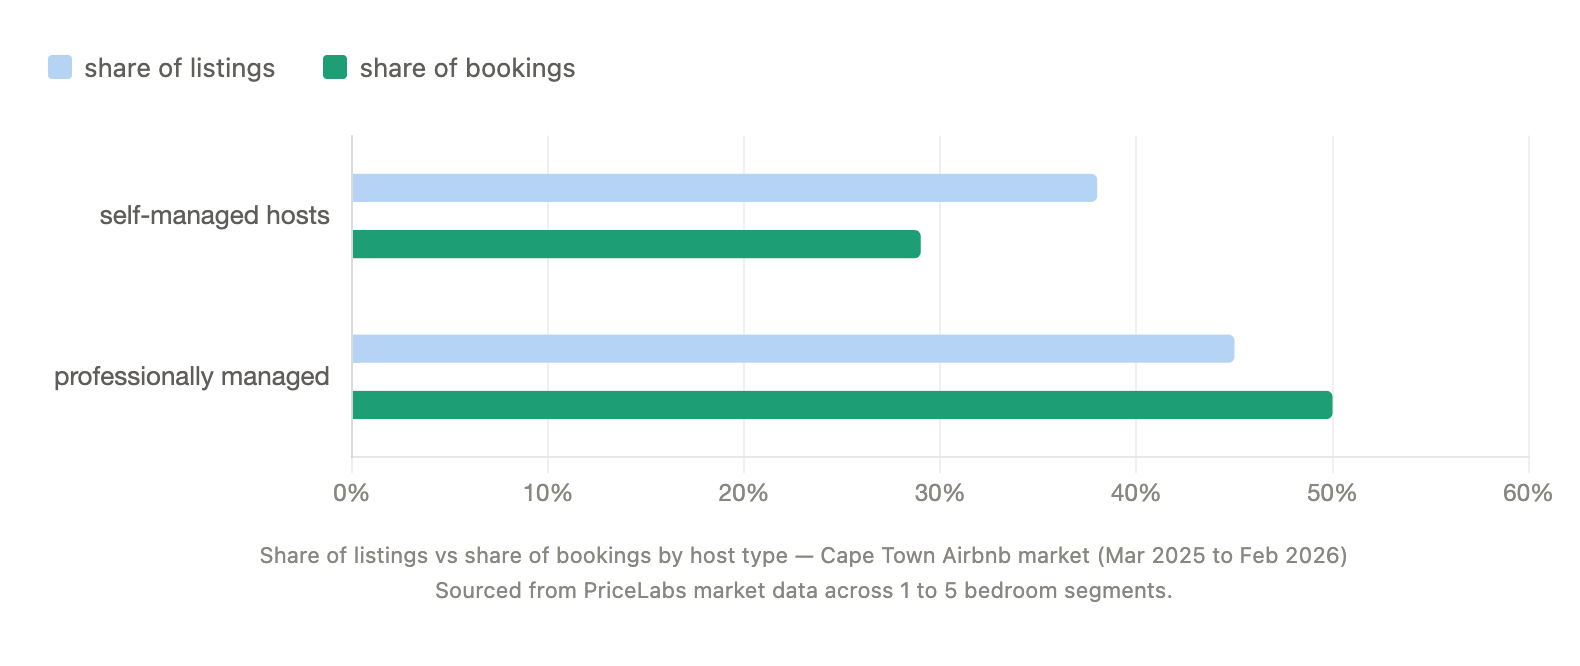
Here is what the data shows. Individual self-managing hosts account for roughly 38% of all active Airbnb listings across this market. Their share of total bookings is less than 30%. That gap exists across every bedroom category, every season, and every price point in the data. It is consistent and it is growing.
The reason sits in operational complexity. And it compounds quietly in the background, whether an owner is aware of it or building it into their thinking.
Pricing is the clearest illustration. Nearly half of all Airbnb listings in Cape Town are operating with a fixed rate. The same price in peak January as in quiet June. The booking data shows clearly what happens to those properties relative to the ones being actively priced. The difference in booking capture is significant and measurable.
Dynamic pricing is one of many moving parts that directly impact Airbnb income, and it rarely produces results in isolation. The tool requires accurate market intelligence to function well. It needs calibration against competitor behaviour, local event demand, seasonal patterns, and platform algorithm signals. It requires someone monitoring it and adjusting when conditions shift. A property with one pricing tool switched on but everything else left to default will see modest improvement at best. The properties generating meaningfully stronger income are the ones where every variable is optimised together, consistently, over time.
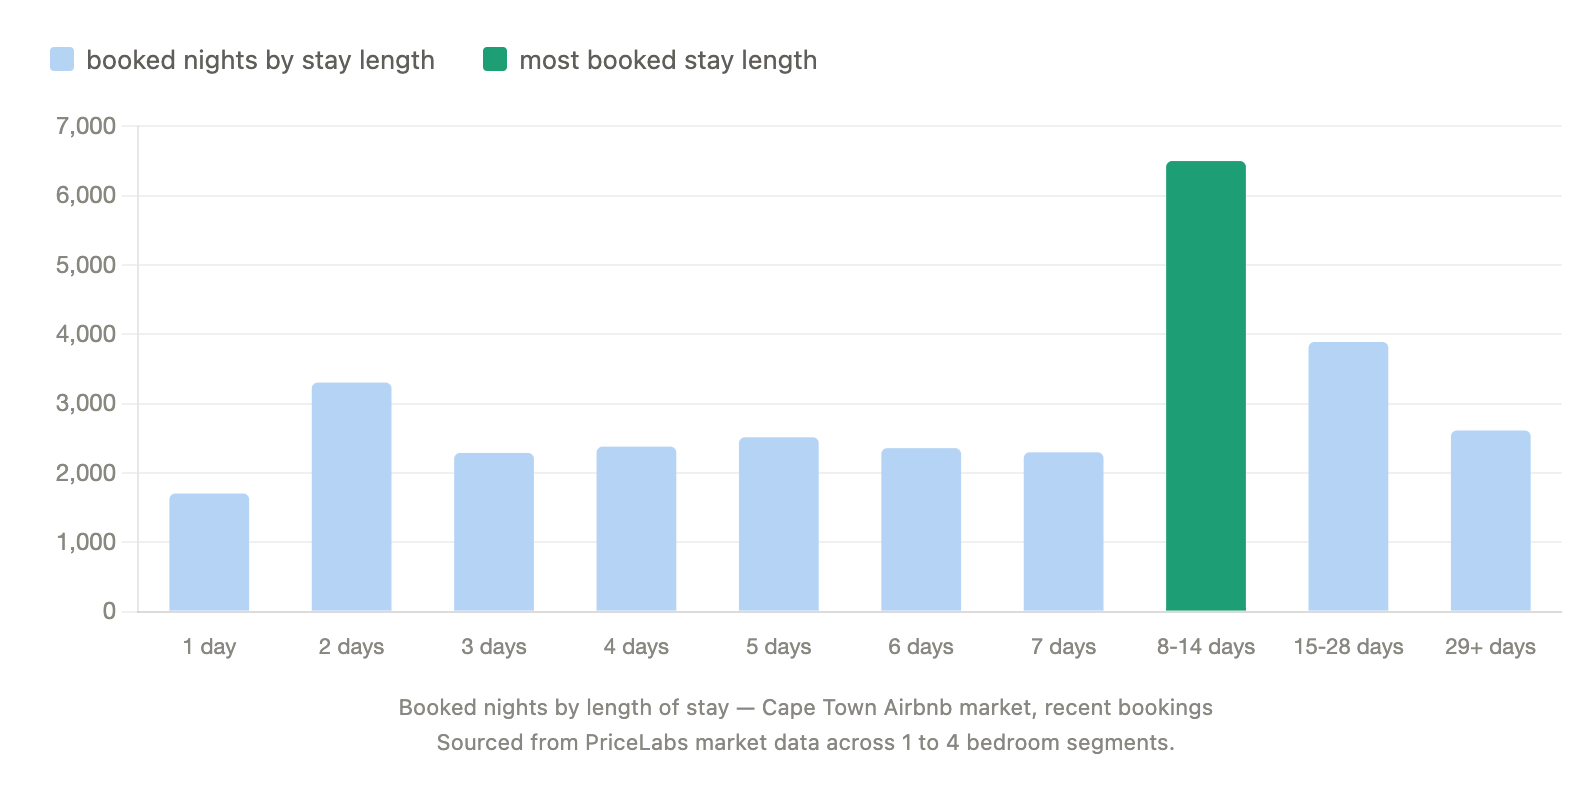
The extended stay pattern in the data makes the same point from a different angle. The single largest booking category across Cape Town Airbnb listings right now is stays of 8 to 14 nights. These guests generate the highest revenue per booking and the lowest operational cost per night. Whether a property is configured to attract them depends on minimum stay settings, weekly pricing structures, and calendar management that most owners set once and rarely revisit. The data suggests a large proportion of self-managed properties are inadvertently directing these guests toward better-configured competitors.
This is what operational complexity looks like across a live market. A series of settings, calibrations, and daily decisions that individually seem small and collectively determine whether a property is performing at its ceiling or well below it. The owners whose income numbers sit at the top of this market have all of those variables working together. The data is consistent on this point across every segment we looked at.
What 85% peak season occupancy actually looks like
This is what Airbnb income looks like in Cape Town when every variable is actively managed.
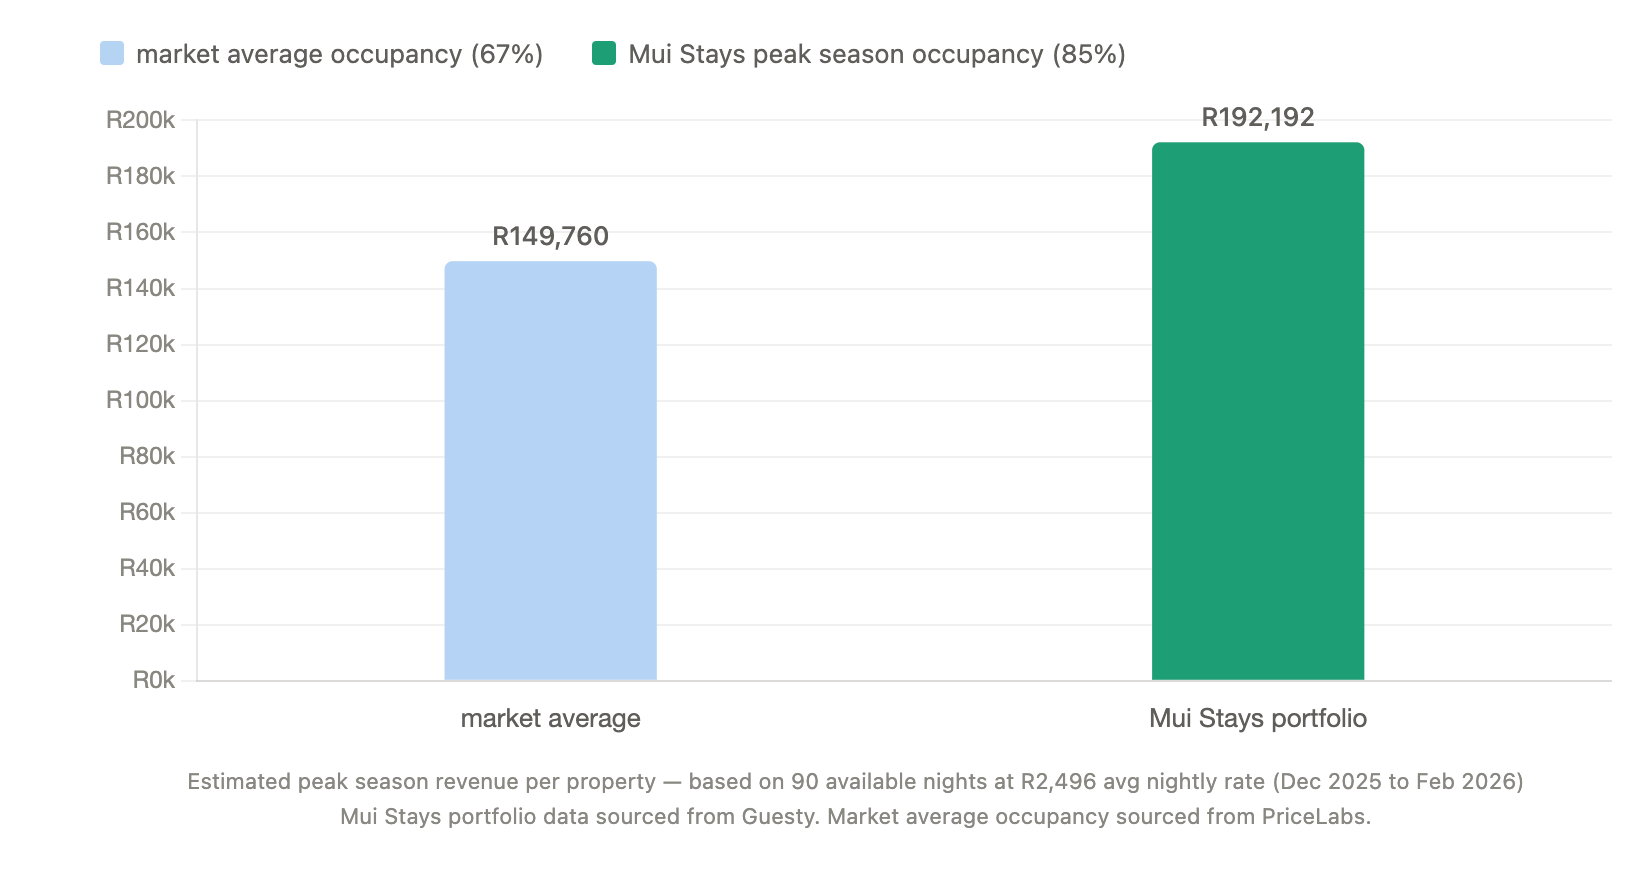
Between December 2025 and February 2026, the Mui Stays portfolio across the Cape Peninsula ran at 85% occupancy. The average nightly rate across that window was R2,496. Multiple properties were fully booked for the entire period. Weekend occupancy across the portfolio reached between 97% and 98%. The market average for the same period sat at 67%.
Converting that gap into real numbers makes it tangible. On a property available for 90 days over peak season, the difference between 67% and 85% occupancy is 16 nights. At an average nightly rate of R2,496, that is approximately R40,000 in additional revenue per property, in a single season.
Those numbers come from a range of property types, sizes, and price points across the Cape Peninsula. What the properties share is consistent, active management applied across every variable that influences income. The location matters. The interior matters. The operational system behind the listing matters considerably more.
The December results were determined in September. Pricing strategy was in place before the first wave of peak season searches arrived on the platforms. Calendars and minimum stay settings were reviewed and configured before demand peaked. Channel distribution was optimised so that bookings came through the platforms delivering the strongest rates alongside strong volume. The operational standards protecting review scores were maintained through every single turnover, every guest communication, every check-in and check-out across the portfolio.
Peak season performance is the visible output of work that runs mostly out of sight, and that is entirely by design. The goal of professional property management is a full calendar and consistent income, generated through a system that operates whether the owner is thinking about their property or doing something else entirely.
The operational details that move the income needle
There are four things the data surfaces consistently across Cape Town Airbnb listings that have a direct impact on income. Each one operates quietly. All of them are worth understanding.
The booking window and how it is managed has a direct effect on what a property earns. The median booking window across this market is 14 days. Most guests are searching and booking within two weeks of arrival. A property with gaps in its calendar inside that window, priced at a rate that reflects September thinking rather than today's demand, will leave those nights unfilled. Empty nights represent permanent revenue loss. Managing the short booking window is a daily exercise that requires real-time pricing decisions and active calendar attention.
Length of stay optimisation affects income in ways that compound across a full season. The dominant booking category in this market by nights booked is the 8 to 14 day stay. These guests generate strong revenue per booking and tend to be the most straightforward operationally. Whether a property attracts them or directs them elsewhere depends on minimum stay settings, weekly pricing configuration, and calendar structure. These variables interact in ways that reward careful setup and ongoing management.
Platform mix shapes the income a property generates from the same pool of demand. Airbnb guests in this market pay meaningfully more per night on average than guests arriving through other major booking platforms. Managing distribution across multiple channels requires understanding which platforms deliver which guest profile at which price point, and making active decisions about where to focus, how to price per channel, and how to maintain listing quality across all of them simultaneously.
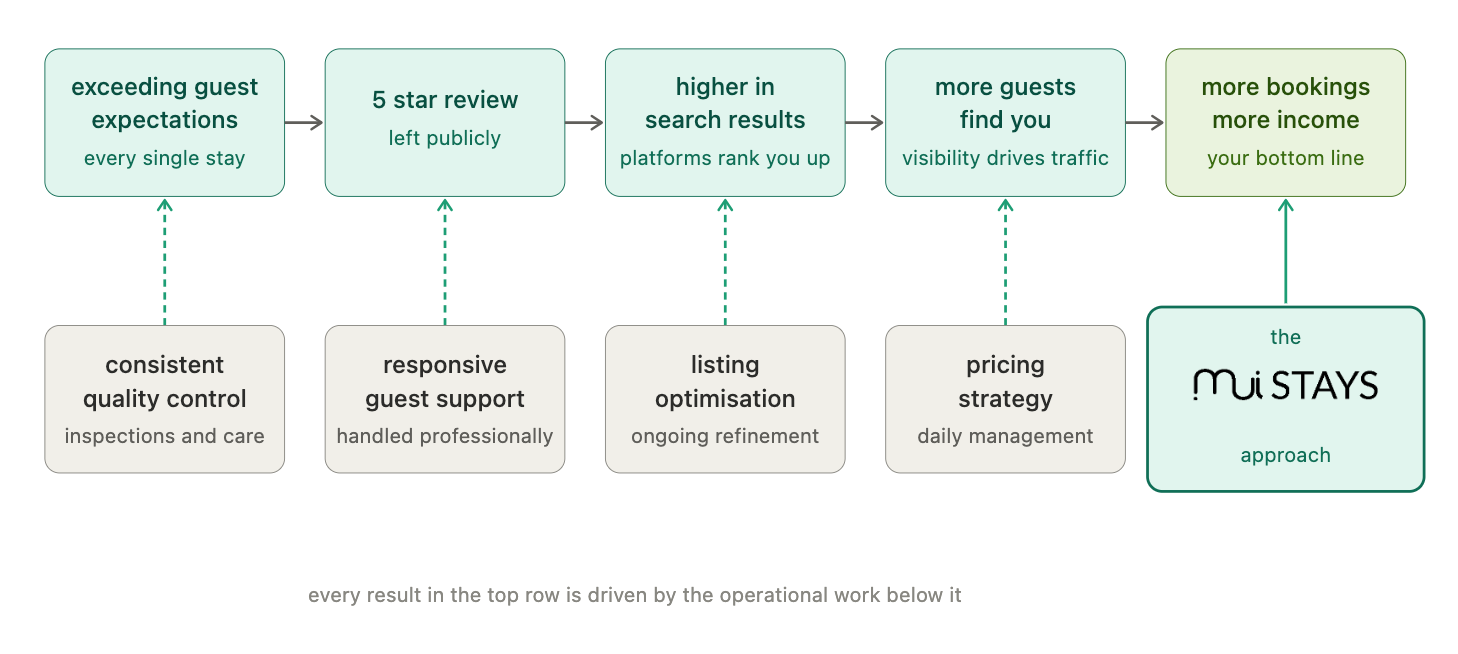
Guest experience standards determine review scores, and review scores determine platform visibility, and platform visibility drives booking volume. The data across this market shows a consistent pattern of small guest expectations that, when met consistently, protect and strengthen a property's position on every platform it appears on. When those standards are maintained through professional operational management rather than best-effort self-management, the compounding effect on visibility and income over a full year is significant.
These four variables are interconnected. Optimising one without the others produces limited results. Managing all of them well, consistently, across a live property in a competitive market, is what professional property management actually involves. The income gap in this market between properties where that is happening and properties where it is reflects exactly that.
What this means for your Cape Town property
The data in our research points in one direction consistently. The Cape Town Airbnb market is performing. Demand is real, rates are strengthening, and the opportunity for well-managed properties is growing. What determines whether a property captures that opportunity fully is almost entirely operational.
For the owner who has been managing their own Cape Town Airbnb and reading this with a growing sense that the numbers could look different, that instinct is worth acting on. The gap between where most self-managed properties sit and where the market's best performing properties are is measurable in real revenue. The market is ready to deliver more. The question is whether the operational system behind a property is ready to capture it.
For the Mui Stays owner reading this and wondering what all of this work looks like in practice, this post is the answer. The pricing decisions made months before peak season. The channel calibration that brings in the right guests at the right rate. The operational consistency that protects review scores and platform visibility through every single turnover. The 85% occupancy and R2,496 average nightly rate last summer are the output of that system running as it should. That is what professional management delivers. The data makes the value of it plain.
For the owner sitting on a Cape Town property that has yet to be activated, the market data makes a straightforward case. Demand exists across every bedroom category. The season is long. Guests are searching and booking and paying strong rates. The difference between a property that captures that demand well from day one and one that learns slowly through lost revenue is the quality of management behind it from the start.
The biggest cost most owners never see is underperformance. It does not appear on an invoice. It shows up as the gap between what a property earned and what the data shows it could have earned with the right system behind it.
Mui Stays manages properties across the Cape Peninsula with consistent hosting standards, active revenue management, multi-channel distribution, and local market knowledge built from being inside this market every single day. The results in this post are a track record, built across a real portfolio in this real market.
If you want to understand how your property compares to current Airbnb income benchmarks in Cape Town, we will run the numbers with you. No obligation. Just an honest look at where your property stands and what the opportunity ahead of it actually represents.
The data is there. The market is ready. The question is whether your property is positioned to make the most of it.